Accepting and Meeting the Challenge
DataArt had to both understand EpiQMAx’s business concerns and enhance its existing services. We created a state-of-the-art software for data visualization, providing feature-rich mass-spectrometry data analysis that leveraged modern principles of user experience (UX) and user-centered design (UCD):
- Eight chart types with multitudes of configuration possibilities
- Flexible mechanism for data inputs mapping for axes
- Various charts layout configuration possibilities tailored to data visualization in healthcare needs
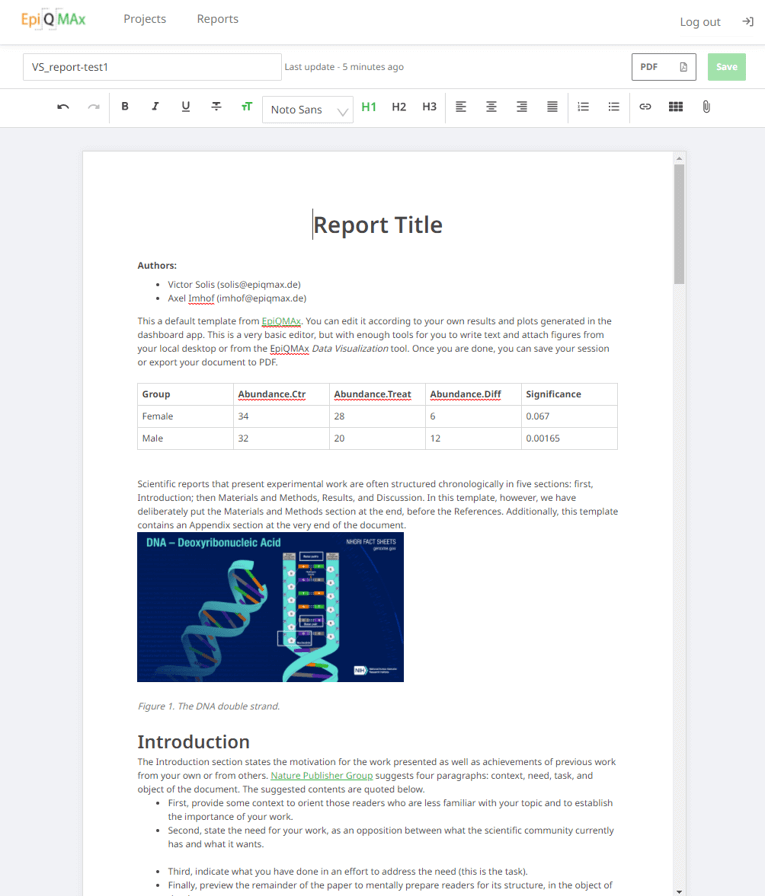
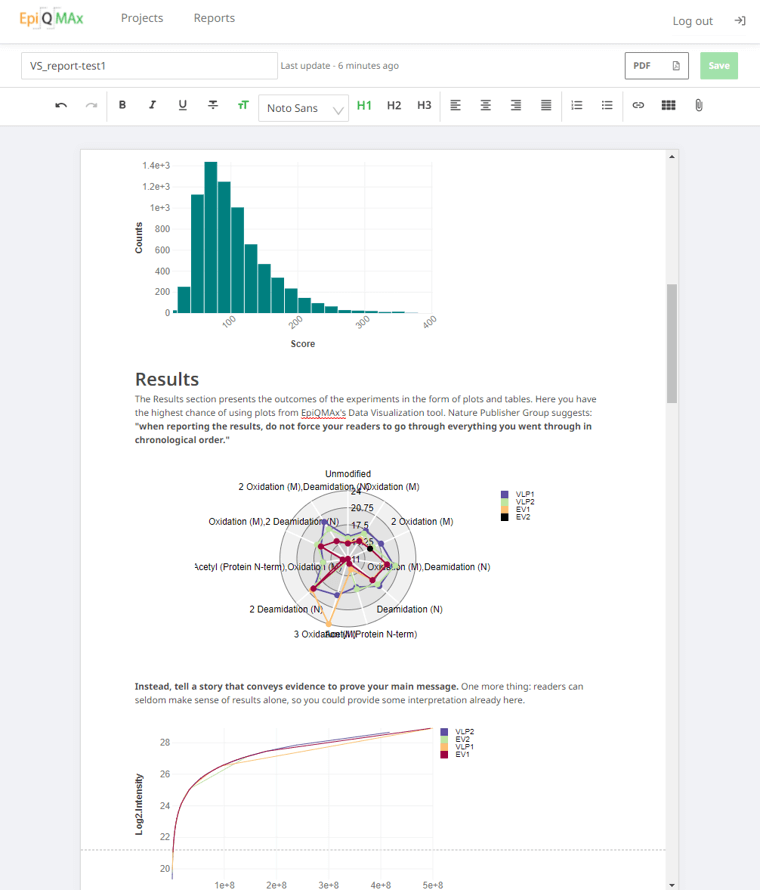
- PDF report generator with editing capabilities:
- a professional final view of the data
- charts, tables, images, and free text combined in a single document
DataArt delivered an operational and attractive web-based software for data visualization that stands out for its flexibility and usability, giving the company a competitive edge, leaving it well positioned in the industry.
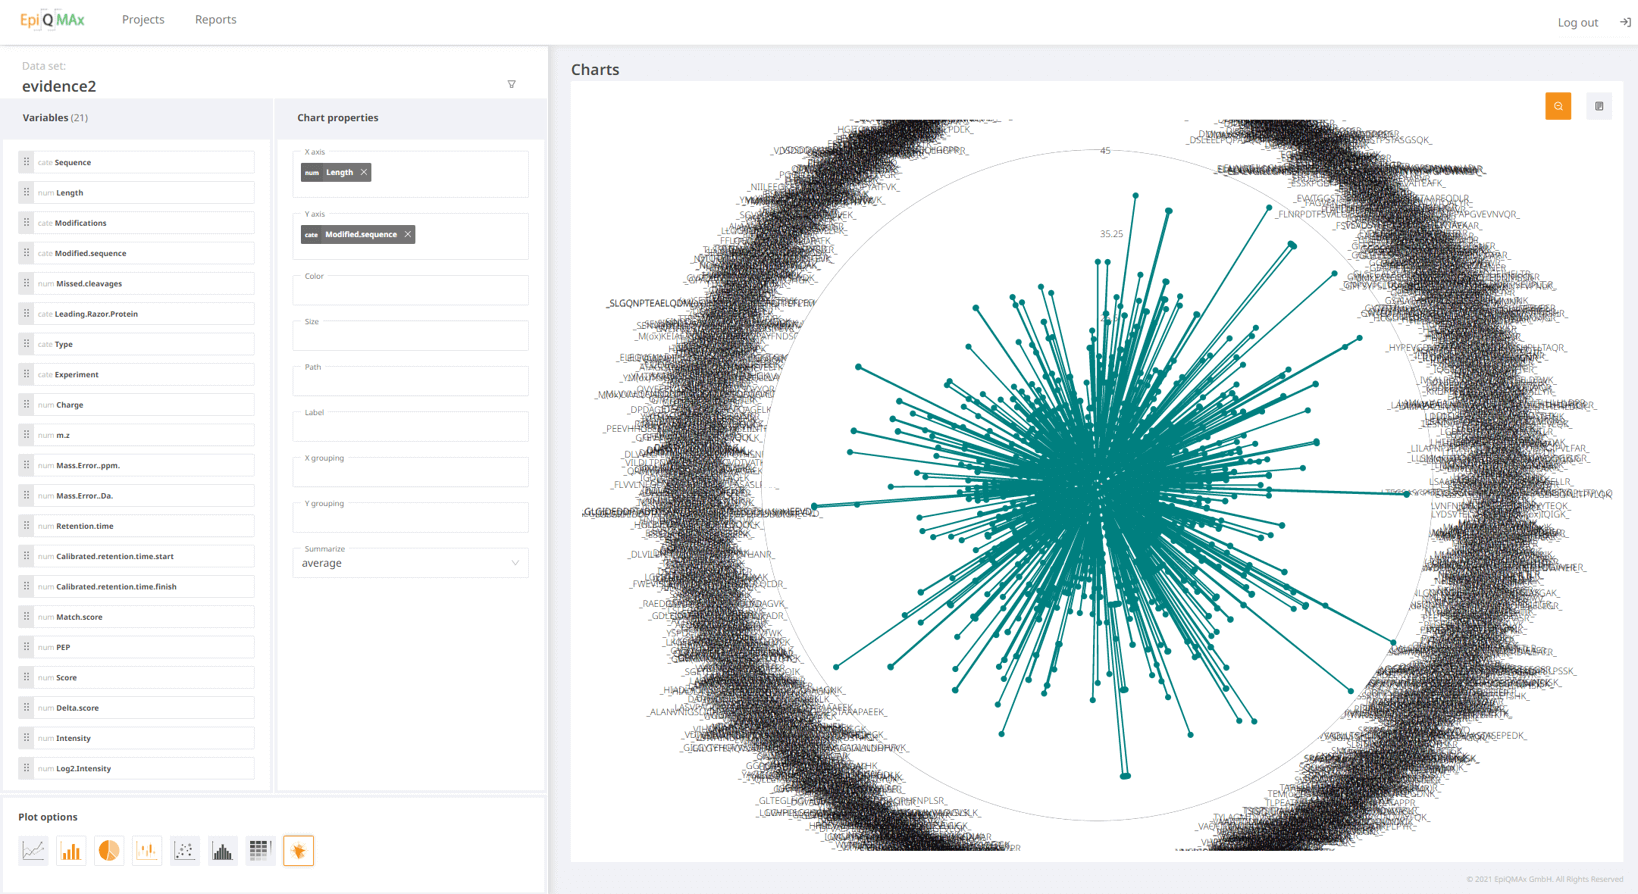
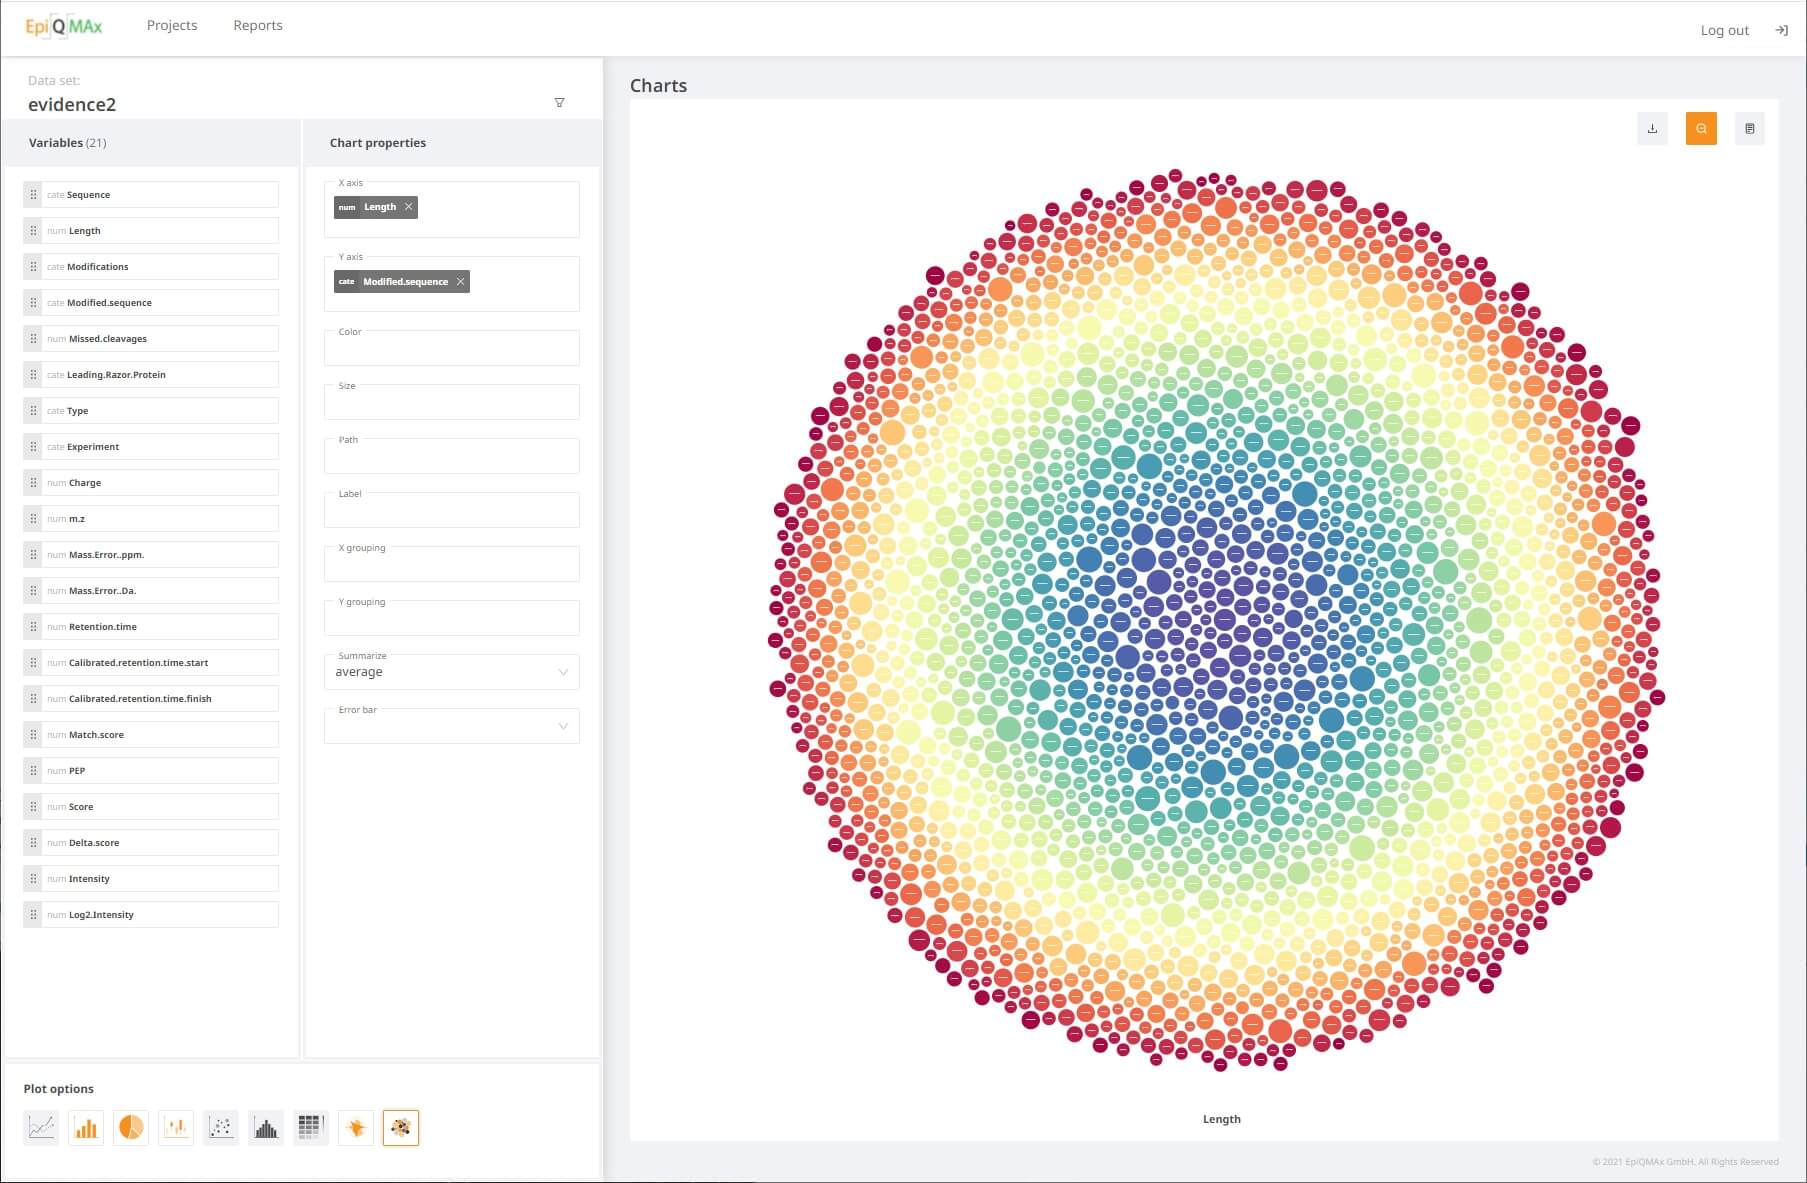
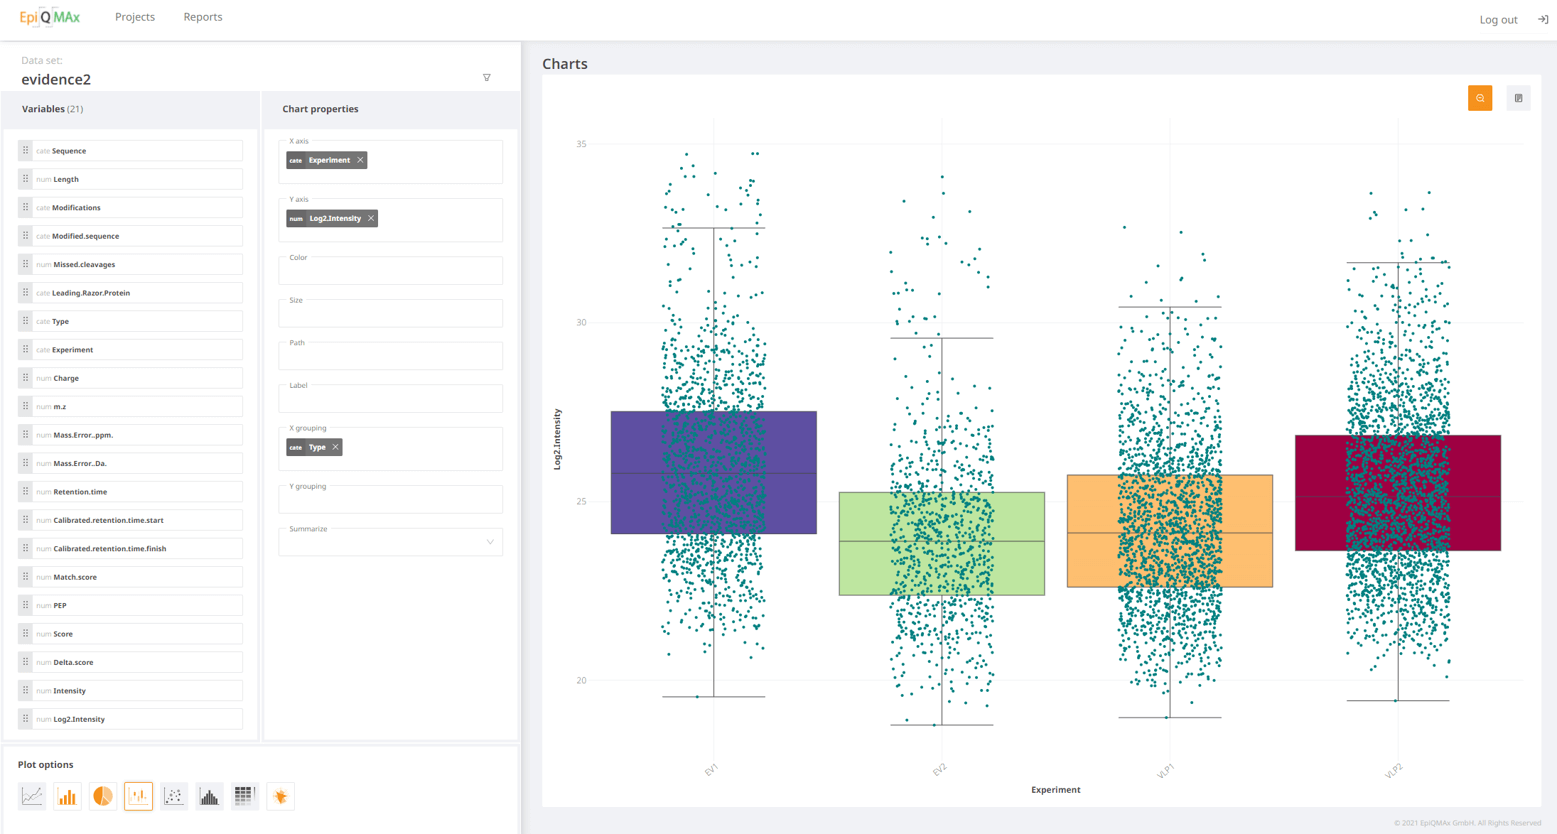
The screenshots below are from the actual system and offer examples of the system’s representation of spectrometry analysis data.
Key Features
- Graphical View of Data (8 different plot options)
- Effective Reports Editor — Convertible into PDF
- Flexible Project Management Tailored for Data Visualization in Healthcare
- Navigate/ Break down/ Filter/ Analyze your data
- Product Differentiation
Technologies
ReactJS & D3.js on Front-end
PHP on Back-end


